


“How do you create the 3D survey of my site?” We get this question all the time. It’s a good one, and definitely something you should care about.
Producing accurate, useful 3D drone surveys requires three ingredients: aerial drone imagery, good ground control, and the science of photogrammetry. But the actual process that builds your site’s 3D terrain model, like the Propeller Platform’s photogrammetry software, can seem mysterious.
We wanted to demystify the science and complexity behind making these 3D surveys. We’re going to focus on photogrammetry in this post, but you can also read about ground control or how to capture quality data.
What is photogrammetry?
At its most basic, “photogrammetry” is measuring via photos. It might sound dry and complicated, but its inner workings define the way we fly.
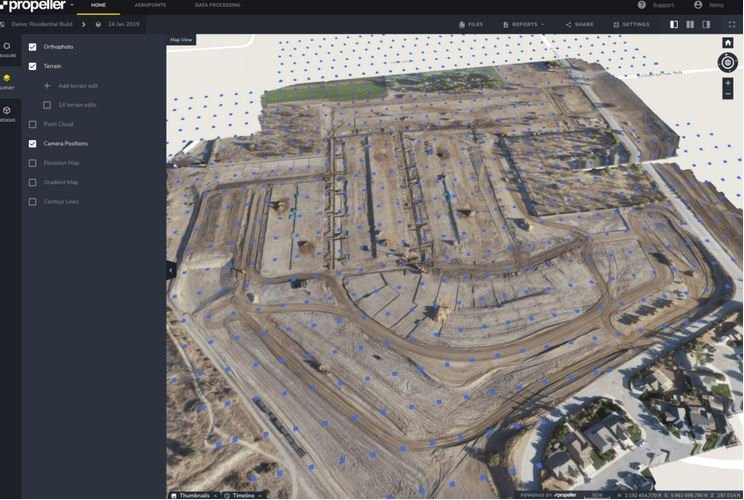
When you send your drone up, it takes pictures of your site with lots of overlap. The 80% overlap on each picture is necessary for two reasons:
- For the computer to stitch images together to make the orthophoto.
- To capture enough angles of each feature to model it in 3D.
We can’t overstate the importance of steady, consistent flight in getting these photos right for drone photogrammetry. (The best way to achieve that is with a flight planning app. We recommend DJI’s Ground Station Pro, which you can read more about in our Surveyor’s Guide to Drones blog series.)
The gist of the science
Essentially, if you see the same feature from three or more known positions, you can triangulate its location in space (a.k.a nail down those exact X, Y, and Z coordinates). A feature is any visually distinct point in an image.
If you took an average image from your survey, you’d easily be able to pick out many “features” between images. The more features you match, the better you can relate images to each other and reconstruct objects within them. This is exactly what photogrammetry software does for one feature, and the next, and the next, and so on, until it’s covered your entire site.
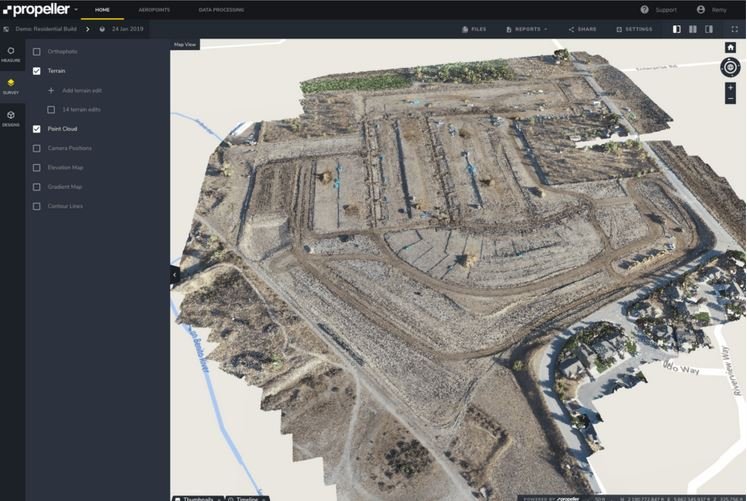
Once you have a lot of these features—think millions—you can create a “cloud” of points. Each point has a matched feature describing your surveyed area in that location. You can then turn your point cloud into any regular outputs used in geospatial software, like a 3D mesh or digital elevation model (DEM).
You’re using photogrammetry right now
The best way to visualize this is to use your eyes—literally. Your eyeballs are using photogrammetry all the time.
You have two eyes (two cameras), processing a live feed of your surroundings. Because your eyes are slightly apart, you’re getting two different inputs at slightly different angles. (Test this yourself by holding up a finger in front of your face. Look at it with one eye closed, then the other. You’ll notice your finger jumps relative to background objects.)
Your brain knows how far apart your eyes are, which allows it to process this info into a sense of distance by merging both feeds into a single perspective. (If you’ve ever tried to catch a ball with one eye closed, you know it’s difficult, as you have no depth perception.)
Your mind is rendering a live depth map of the 3D world from two 2D inputs—just like how Propeller renders a 3D survey from many 2D photos.
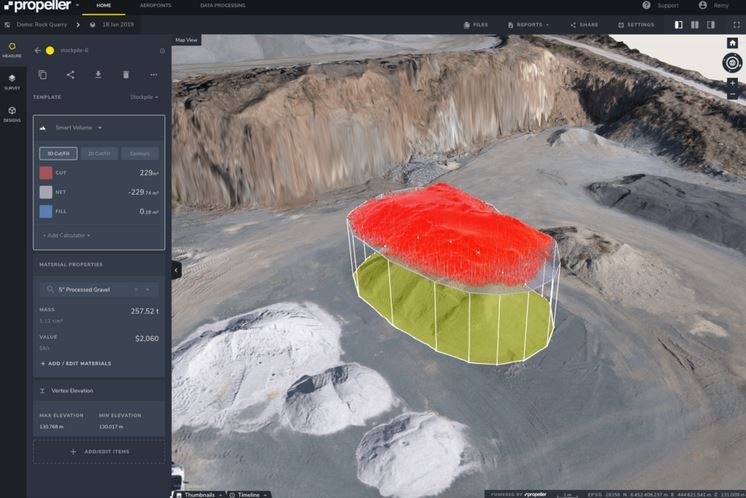
And because Propeller’s drone photogrammetry software is also processing physical measurements like the altitude of the photos and locations from ground control, the 3D survey contains all the accurate real-world quantities you need to measure on your site, like distances, volumes, and gradients.
Credits: propellaraero


